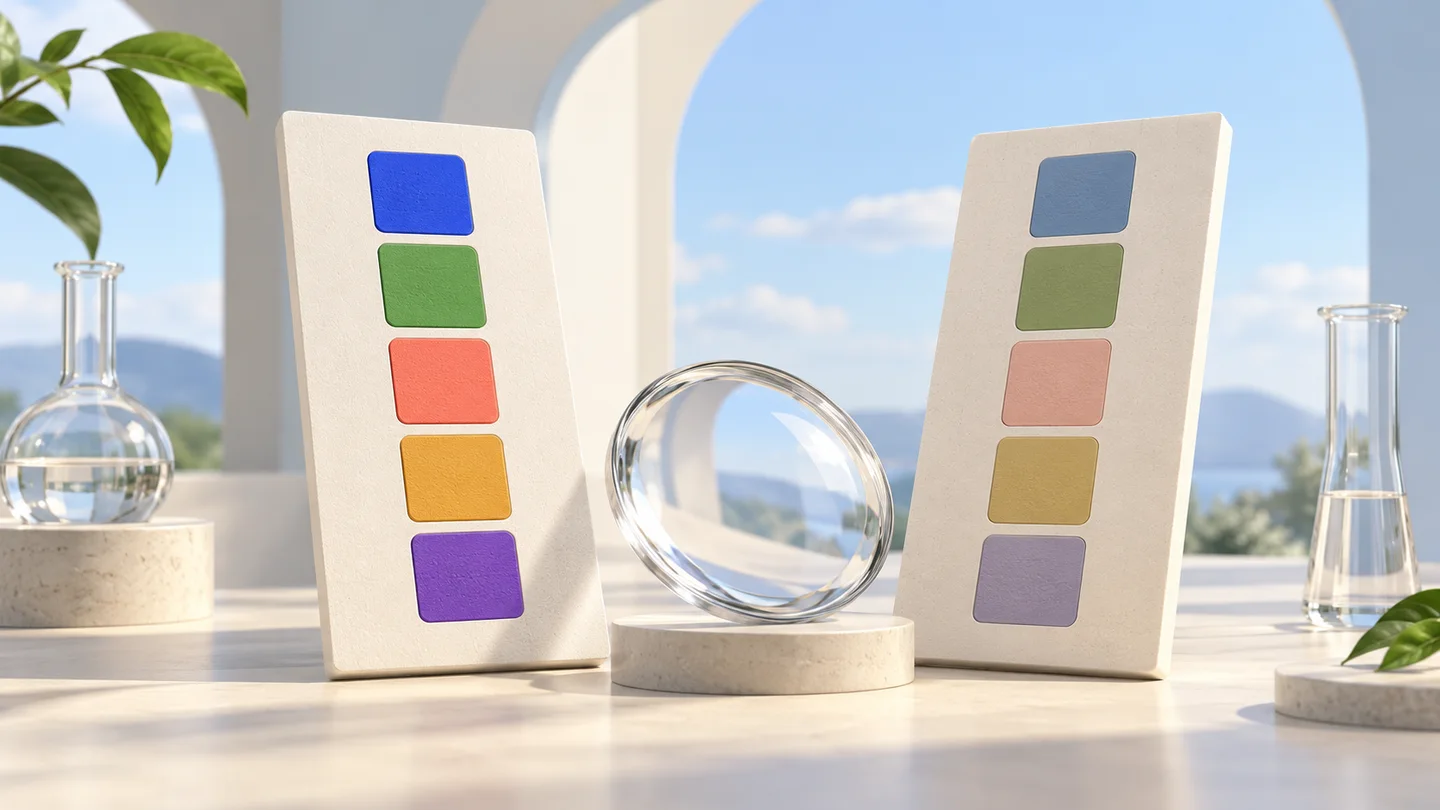
Preview a palette under different color vision conditions
Edit five opaque colors and compare the original with three model-based views.
Swatches side by side
Each view preserves the same five positions. HEX values are simulated display approximations, not replacement brand colors.
Original · sRGB
1
2
3
4
5
Color 1#2563eb
Color 2#16a34a
Color 3#e11d48
Color 4#eab308
Color 5#9333ea
Protanopia · red-cone deficiency
1
2
3
4
5
Color 1#0076f0
Color 2#a49442
Color 3#5f5a48
Color 4#cbb300
Color 5#0069ef
Deuteranopia · green-cone deficiency
1
2
3
4
5
Color 1#0064e8
Color 2#958951
Color 3#8e8242
Color 4#d8c11d
Color 5#006ae6
Tritanopia · blue-cone deficiency
1
2
3
4
5
Color 1#00869d
Color 2#00a08f
Color 3#f70032
Color 4#ffa199
Color 5#80658f
The last valid result is still shown. Correct the inputs before copying or downloading.
Machado, Oliveira & Fernandes (2009), severity 1.0 endpoints, applied to linear sRGB. Results are clipped to sRGB and encoded for display. This is a design approximation, not a vision test.
Wide-gamut inputs are mapped to sRGB for this model. The original input text remains in the report.
Some transformed channels are outside the display gamut and have been clipped to sRGB.
Look beyond the swatches
The selected view is also applied to these sample components, including their light and dark surfaces. Labels, symbols and bar labels stay the same.
The JSON report includes original inputs, mapped original HEX and all three simulated HEX palettes, with model details. It is not an accessibility certificate.
This tool previews design risks. It cannot diagnose color vision or reproduce every person’s perception.
Color calculations run in your browser. The website still loads assets, advertising and analytics.
Keep meaning when colors get closer
Use simulation to inspect design decisions, then add information beyond color.
Compare three models with the original
The four views retain palette order so similar-looking colors are easier to spot. Protanopia, deuteranopia and tritanopia use distinct published matrices at their severity 1.0 endpoints. The original view is the model’s sRGB input, not a claim about any particular person’s vision.
Make labels and shapes do useful work
A status should say what happened, and a chart should identify its series. The component preview combines words, symbols and labeled bars with color. Simulation helps find risks; it does not replace a contrast check or user evaluation.
How to review a palette with the simulator
Compare, add cues and verify the actual interface.
01
Enter five opaque colors
Paste your palette into the numbered fields. Inputs outside sRGB are mapped before the model runs. Transparent inputs are rejected because their appearance depends on the background; resolve that composite first.
02
Compare swatches and components
Review all three views alongside the original. Select a view for the status and chart examples. Look for colors that become hard to distinguish, and check whether the text or marker still communicates the meaning.
03
Keep the report and check contrast separately
Copy or download JSON to record the palette and model. The full URL preserves the five inputs and selected view. Use the contrast checker on actual original foreground/background pairs and review the complete design with users when possible.
Continue your color workflow
Explore a palette or check a real foreground and background.
Color palette generator
Build five-color harmonies, lock favorites and export the palette.
The model, its limits and what to do with the preview.
Is this a test of my own color vision?
No. This is a design preview of a palette under modeled color vision conditions. It cannot determine your color vision and does not provide a medical diagnosis.
Which types of color blindness are simulated?
The tool shows protanopia, deuteranopia and tritanopia using the severity 1.0 endpoint matrices of Machado, Oliveira and Fernandes (2009), alongside the original sRGB palette. It does not offer anomalous-trichromacy severity controls or achromatopsia simulation.
Does the simulation show exactly what every person sees?
No. A model approximates some color transformations. Perception, display conditions and individual differences vary. Treat the preview as a way to find risks, and combine it with clear labels, shapes and evaluation of the actual design.
Why do these results differ from a desaturation filter?
The three views use different published matrices on linearized sRGB channels, then convert back for display. A grayscale or desaturation filter is a different transformation and does not represent these three conditions.
Does simulation replace a WCAG contrast check?
No. Simulation helps inspect color distinction; contrast checks assess actual foreground/background luminance. Also avoid conveying meaning through color alone. Neither a successful preview nor one passing contrast pair certifies the whole interface.
Can I use transparency or upload an image?
This first version reviews five opaque palette colors plus sample statuses and a chart. It does not upload or transform images. Resolve a transparent color against its real background before using it here; alpha is rejected rather than ignored.
Why are some colors mapped or clipped?
The model works in linear sRGB. Wide-gamut inputs are mapped to sRGB first. A transformed channel can then fall outside the display range and is clipped. HEX outputs also round to 8-bit values, so they are display approximations.
What does the JSON report contain?
The report records the original color strings, original mapped HEX, all three simulated HEX palettes, the model and severity. It records a design inspection, not corrected brand colors or accessibility certification. Reload and language changes keep current settings through the URL fragment.